
Giải Cam 18, Test 1, Writing task 1: Percentage of the population living in cities
Wrting task 1 là một phần thi không quá khó nếu bạn chăm chỉ luyện tập thường xuyên. Trong bài viết này, hãy cùng tham khảo Sample Writing Task 1 cho đề bài Percentage of the population living in cities trong Cam 18, Test 1, Writing task 1 giúp bạn luyện thi hiệu quả nhé
1. Phân tích đề và các bước làm cam 18 test 1 writing task 1
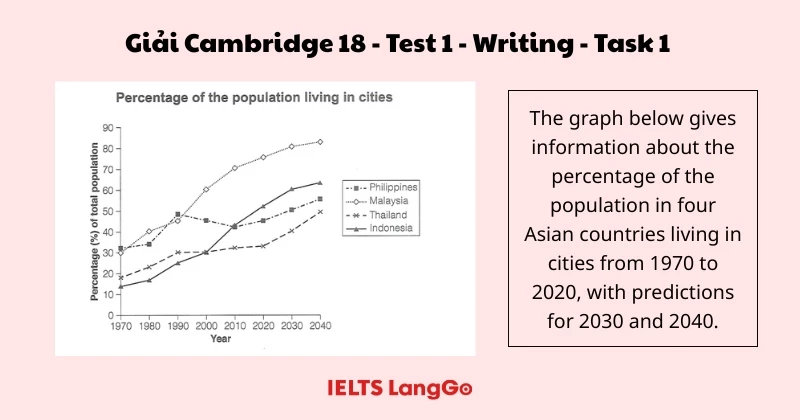
Đề bài: The graph below gives information about the percentage of the population in four Asian countries living in cities from 1970 to 2020, with predictions for 2030 and 2040.
Dịch đề: Biểu đồ dưới đây cung cấp thông tin về tỷ lệ phần trăm dân số ở bốn quốc gia châu Á sống ở các thành phố từ năm 1970 đến 2020, cùng với dự báo cho năm 2030 và 2040.
Đề bài này thường được coi là dạng graph (biểu đồ). Đối với graph, sẽ có ba dạng bài chính là line graph (biểu đồ đường), bar chart (biểu đồ cột) và pie chart (biểu đồ tròn). Và đề bài trên là một dạng đề tiêu biểu của line graph.
Dạng đề: Line Graph
Các bước làm bài:
- Analyze the topic (phân tích đề bài): Với các đề line graph tiêu biểu như thế này, các bạn sẽ cần phân tích subjects (đối tượng), unit (đơn vị) và timeline (dòng thời gian).
Với bài này chúng ta có cả thời điểm trong quá khứ và tương lai nên ta sẽ dùng kết hợp thì quá khứ đơn và thì tương lai với các prediction verbs (động từ dự đoán).
- Write the introduction: Để viết được đoạn mở bài, các bạn chỉ cần paraphrase lại đề bài theo từ vựng của mình.
- Find out noticeable features and write the overview: Bước tiếp theo sẽ là viết overview. Với overview của dạng bài line graph thì tương đối đơn giản. Công thức sẽ là các bạn cần viết 2 câu: câu thứ nhất nêu lên xu hướng chung (tăng, giảm) của các đối tượng và câu thứ hai nêu lên đối tượng nổi bật nhất (cao nhất, thấp nhất hay có sự thay đổi lớn nhất).
- Pick out the information to put into 2 body paragraphs: Cuối cùng sẽ là bước viết body. Tuy nhiên, trước khi viết body thường các bạn sẽ cần chắt lọc thông tin, đưa ra outline về hướng viết bài rồi mới đi tới viết đoạn chi tiết.
Phần này sẽ được chia thành 2 đoạn body. Cụ thể với đề này, các bạn có thể chia như sau: Body 1 viết về Malaysia và Indonesia - Body 2 viết về Philippines và Thailand. Cách chia này sẽ là tối ưu nhất cả về nội dung cũng như dung lượng hình thức của 2 đoạn sẽ cân bằng hơn.
2. Outline bài viết Cam 18 test 1 writing task 1
Hãy tham khảo outline phân tích biểu đồ Percentage of the population living in cities nhé:
- Introduction
Paraphrase the topic: The graph -> the chart, gives information about -> provides details about, the percentage of the population in four Asian countries living in cities -> the urbanisation rates in four nations in Asia, from 1970 to 2020 -> over five decades starting from 1970, with predictions for 2030 and 2040 -> with future projections for 2030 and 2040.
- Overview
Overall trend: Upward trend in all four countries.
Most remarkable feature: Malaysia - highest during most of the period shown.
- Body 1
Malaysia & Indonesia
1970: M (30) > I - lowest (13)
1970 - 1990: M increased (47); I increased (30)
1990-2020: M increased (75); I increased (50)
2020-2040: M is predicted to increase (82); I is predicted to increase (60)
- Body 2
Philippines and Thailand
1970: P - highest (31) > T (19)
1970 - 1990: P increased (50); T increased (30)
1990 - 2010: P hit the bottom (45); T stayed constant
2010 - 2040: P is predicted to increased (55); & T is predicted to increase (50)
3. Bài mẫu Cam 18 test 1 writing task 1: Percentage of the population living in cities
Cùng tham khảo bài mẫu sau đây bạn nhé:
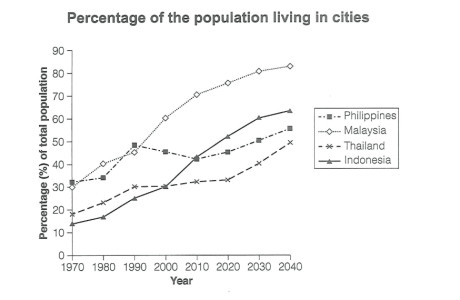
The chart gives information about the urbanisation rates in four nations in Asia over five decades starting from 1970, with future projections for 2030 and 2040.
From a general perspective, all four countries have experienced a rise in urban populations over time, and this upward trend is expected to persist. Also, it is notable that Malaysia has witnessed the largest proportion of people residing in urban areas during most of the period shown.
A closer examination at the graph reveals that in 1970, Malaysia had approximately 30% of its population residing in urban areas, while Indonesia recorded the lowest figure, at just 13%. Over the following two decades, both nations witnessed sharp increases—Malaysia’s urban population rose significantly to 47% and Indonesia’s climbed steadily to 30% by 1990. From 1990 to 2020, urbanisation in both countries accelerated further. Malaysia reached a high of 75%, whereas Indonesia grew gradually to 50%. According to forecasts, this growth will continue, with Malaysia projected to hit a peak of 82% by 2040, and Indonesia expected to rise moderately to 60%.
By comparison, the Philippines had the highest urban population in 1970, at 31%, compared to Thailand’s relatively low figure of 19%. Between 1970 and 1990, the Philippines experienced a dramatic surge to 50%, while Thailand increased at a slower pace to 30%. However, from 1990 to 2010, the Philippines saw a slight dip, dropping to a low point of 45%, while Thailand’s urban population remained relatively flat. In the future, both countries are predicted to recover and grow steadily, with the Philippines reaching 55% and Thailand climbing gradually to 50% by 2040.
Bản dịch:
Biểu đồ cung cấp thông tin về tỷ lệ đô thị hóa ở bốn quốc gia châu Á trong vòng năm thập kỷ bắt đầu từ năm 1970, kèm theo dự báo cho các năm 2030 và 2040.
Nhìn chung, cả bốn quốc gia đều đã chứng kiến sự gia tăng về dân số sống ở khu vực thành thị theo thời gian, và xu hướng tăng này được dự đoán sẽ còn tiếp tục. Ngoài ra, đáng chú ý là Malaysia đã ghi nhận tỷ lệ người dân sống ở khu vực đô thị cao nhất trong phần lớn thời gian được thể hiện.
Xem xét kỹ hơn biểu đồ, có thể thấy vào năm 1970, khoảng 30% dân số Malaysia sống tại các khu vực đô thị, trong khi Indonesia ghi nhận tỷ lệ thấp nhất, chỉ ở mức 13%. Trong hai thập kỷ tiếp theo, cả hai quốc gia đều chứng kiến sự gia tăng mạnh mẽ — tỷ lệ đô thị hóa ở Malaysia tăng đáng kể lên 47% và ở Indonesia tăng đều lên 30% vào năm 1990. Từ năm 1990 đến 2020, quá trình đô thị hóa ở cả hai quốc gia này tiếp tục tăng nhanh. Malaysia đạt mức cao 75%, trong khi Indonesia tăng dần lên 50%. Theo dự báo, xu hướng tăng này sẽ tiếp diễn, với Malaysia dự kiến đạt đỉnh 82% vào năm 2040, và Indonesia được dự đoán sẽ tăng vừa phải lên 60%.
So sánh với hai quốc gia còn lại, Philippines có tỷ lệ dân số đô thị cao nhất vào năm 1970, ở mức 31%, so với con số tương đối thấp của Thái Lan là 19%. Từ năm 1970 đến 1990, Philippines đã trải qua một sự gia tăng đột biến lên 50%, trong khi Thái Lan tăng chậm hơn, đạt 30%. Tuy nhiên, từ năm 1990 đến 2010, Philippines ghi nhận một sự sụt giảm nhẹ, xuống mức thấp nhất là 45%, trong khi tỷ lệ đô thị hóa ở Thái Lan giữ tương đối ổn định. Trong tương lai, cả hai quốc gia được dự đoán sẽ phục hồi và tiếp tục tăng đều, với Philippines đạt 55% và Thái Lan tăng dần lên 50% vào năm 2040.
Vocabulary:
- urbanisation rate (n): tỷ lệ đô thị hoá
E.g. The urbanisation rate in Vietnam has been steadily increasing over the past few decades, reflecting the country’s shift from an agriculture-based economy to one that is more industrialised and service-oriented. (Tỷ lệ đô thị hóa ở Việt Nam đã tăng đều trong vài thập kỷ qua, phản ánh sự chuyển đổi của đất nước từ một nền kinh tế nông nghiệp sang công nghiệp và dịch vụ.)
- experience a rise (phr.): chứng kiến sự gia tăng
E.g. All four countries experienced a noticeable rise in the proportion of people living in urban areas between 1970 and 2020, largely due to economic development and population growth. (Cả bốn quốc gia đều chứng kiến sự gia tăng rõ rệt về tỷ lệ dân cư sống ở thành thị từ năm 1970 đến 2020, chủ yếu nhờ phát triển kinh tế và sự gia tăng dân số.)
- upward trend (n): xu hướng tăng
E.g. The data shows a clear upward trend in urbanisation across all countries, indicating a consistent movement towards urban living over the span of seven decades. (Dữ liệu cho thấy một xu hướng tăng rõ rệt trong đô thị hóa ở tất cả các quốc gia, thể hiện sự chuyển dịch đều đặn về cuộc sống thành thị trong suốt bảy thập kỷ.)
- most of the period shown (phr.): phần lớn thời gian được thể hiện
E.g. Malaysia maintained the highest urban population among the four nations for most of the period shown, suggesting a more advanced stage of urban development. (Malaysia duy trì tỷ lệ dân số thành thị cao nhất trong số bốn quốc gia trong phần lớn thời gian được thể hiện, cho thấy một giai đoạn phát triển đô thị cao hơn.)
- record (v): ghi nhận
E.g. In 1970, Indonesia recorded the lowest percentage of urban residents, which later increased steadily as industrialisation progressed. (Năm 1970, Indonesia ghi nhận tỷ lệ cư dân thành thị thấp nhất, sau đó tăng đều khi quá trình công nghiệp hóa tiến triển.)
- witness sharp increase (phr.): chứng kiến sự tăng mạnh
E.g. Between 1970 and 1990, Malaysia witnessed a sharp increase in its urban population, rising from 30% to nearly 50%, reflecting rapid development in infrastructure and job opportunities. (Từ năm 1970 đến 1990, Malaysia chứng kiến sự tăng mạnh trong dân số thành thị, từ 30% lên gần 50%, phản ánh sự phát triển nhanh chóng về cơ sở hạ tầng và cơ hội việc làm.)
- significantly (adv): đáng kể
E.g. Urbanisation in Southeast Asia grew significantly during the 1980s and 1990s, as governments invested heavily in urban infrastructure and economic zones. (Đô thị hóa ở Đông Nam Á đã tăng đáng kể trong những năm 1980 và 1990, khi chính phủ đầu tư mạnh vào cơ sở hạ tầng đô thị và các khu kinh tế.)
- climb steadily (phr.): tăng đều
E.g. Indonesia’s urbanisation rate climbed steadily throughout the entire period, indicating consistent population movement from rural to urban regions. (Tỷ lệ đô thị hóa của Indonesia đã tăng đều trong suốt giai đoạn, cho thấy sự chuyển dịch dân số từ nông thôn ra thành thị một cách ổn định.)
- accelerate (v): gia tăng nhanh
E.g. After 1990, the pace of urban growth in Malaysia began to accelerate rapidly, driven by economic expansion and improved living standards in cities. (Sau năm 1990, tốc độ tăng trưởng đô thị ở Malaysia bắt đầu gia tăng nhanh chóng, được thúc đẩy bởi sự mở rộng kinh tế và cải thiện chất lượng sống ở thành phố.)
- reach a high of (phr.): đạt mức cao ở
E.g. By 2040, Malaysia is projected to reach a high of 82% in urban population, outpacing its regional counterparts. (Đến năm 2040, Malaysia được dự đoán sẽ đạt mức cao 82% dân số thành thị, vượt qua các nước trong khu vực.)
- grow gradually (phr.): tăng dần dần
E.g. Unlike the rapid growth seen in Malaysia, Thailand’s urban population grew gradually over the years, suggesting a slower rate of development. (Trái ngược với sự tăng trưởng nhanh ở Malaysia, dân số thành thị của Thái Lan tăng dần dần qua các năm, cho thấy tốc độ phát triển chậm hơn.)
- hit a peak of (phr.): đạt đỉnh ở mức
E.g. The Philippines hit a peak of 50% urban population in 1990 before experiencing a slight decline in the following two decades. (Philippines đạt đỉnh 50% dân số thành thị vào năm 1990 trước khi chứng kiến sự sụt giảm nhẹ trong hai thập kỷ tiếp theo.)
- moderately (adv): một cách vừa phải tương đối
E.g. Indonesia’s urbanisation is predicted to grow moderately in the coming decades, without any dramatic spikes. (Đô thị hóa ở Indonesia được dự đoán sẽ tăng một cách vừa phải trong những thập kỷ tới, không có sự bứt phá mạnh.)
- experience a dramatic surge to (phr.): trải qua một sự tăng mạnh lên
E.g. The Philippines experienced a dramatic surge to 50% urbanisation between 1970 and 1990, mainly due to industrial growth and internal migration. (Philippines đã trải qua một sự tăng mạnh lên 50% đô thị hóa từ năm 1970 đến 1990, chủ yếu do tăng trưởng công nghiệp và di cư nội địa.)
- increase at a slower pace (phr.): tăng với tốc độ chậm hơn
E.g. Thailand’s urban population increased at a slower pace compared to its neighbours, possibly due to its stronger rural economy. (Dân số thành thị của Thái Lan tăng với tốc độ chậm hơn so với các nước láng giềng, có thể do nền kinh tế nông thôn vẫn còn mạnh.)
- see a slight dip (phr.): chứng kiến một sự giảm nhẹ
E.g. After peaking in 1990, the Philippines saw a slight dip in urbanisation, possibly reflecting economic instability or rural revitalisation policies. (Sau khi đạt đỉnh vào năm 1990, Philippines chứng kiến một sự giảm nhẹ trong đô thị hóa, có thể do bất ổn kinh tế hoặc chính sách phục hồi nông thôn.)
- drop to a low point of (phr.): giảm xuống mức thấp nhất là
E.g. The urbanisation rate in the Philippines dropped to a low point of 45% in 2010 before beginning to rise again. (Tỷ lệ đô thị hóa ở Philippines giảm xuống mức thấp nhất là 45% vào năm 2010 trước khi bắt đầu tăng trở lại.)
- remain relatively flat (phr.): duy trì ở mức gần như không đổi
E.g. From 1990 to 2010, Thailand’s urbanisation figures remained relatively flat, showing no significant change during this period. (Từ năm 1990 đến 2010, các số liệu về đô thị hóa ở Thái Lan gần như không đổi, cho thấy không có sự thay đổi đáng kể trong giai đoạn này.)
Trên đây là sample của Writing topic: Percentage of the population living in cities trong Cam 18, Test 1, Writing task 1. Các bạn hãy tham khảo để trau dồi thêm về vốn từ vựng cũng như phương pháp làm dạng bài process này nhé! IELTS LangGo mong các bạn sớm đạt được band điểm Writing như mong muốn!
HỌC IELTS CAM KẾT 7.0+ - GIẢM TỐI ĐA 12 TRIỆU

Bạn là học sinh, sinh viên muốn bứt phá band điểm IELTS? LangGo tặng bạn ưu đãi CỰC LỚN lên tới 12.000.000 VNĐ khi đăng ký lộ trình tăng từ 2 band!
Khóa học IELTS tại LangGo đảm bảo đầu ra lên đến 7.0+:
- CAM KẾT ĐẦU RA theo kết quả thi thật
- Học bổ trợ 1:1 với giảng viên đứng lớp
- 4 buổi bổ trợ Speaking/tháng
- Tăng band chỉ sau 1,5 - 2,5 tháng
- Hỗ trợ đăng ký thi thật tại BC, IDP