Mách bạn một số tips hiệu quả khi làm bài IELTS Writing Task 1 (Phần 2)
Nếu bạn muốn nâng cao khả năng Writing thì không có cách nào khác ngoài việc bạn phải viết thật nhiều, bắt đầu viết từ những chủ đề mình yêu thích và dần dần mở rộng ra những chủ đề khác nữa. Ngoài ra, bạn cũng cần tham khảo các tips làm bài và các bài mẫu để mở rộng vốn từ vựng, trau dồi thêm kinh nghiệm làm bài cho mình.
Hãy cùng LangGo tham khảo phần 2 của series Mách bạn một số tips hiệu quả khi làm bài IELTS Writing Task 1 dưới đây để tự tin làm bài thật tốt nha!
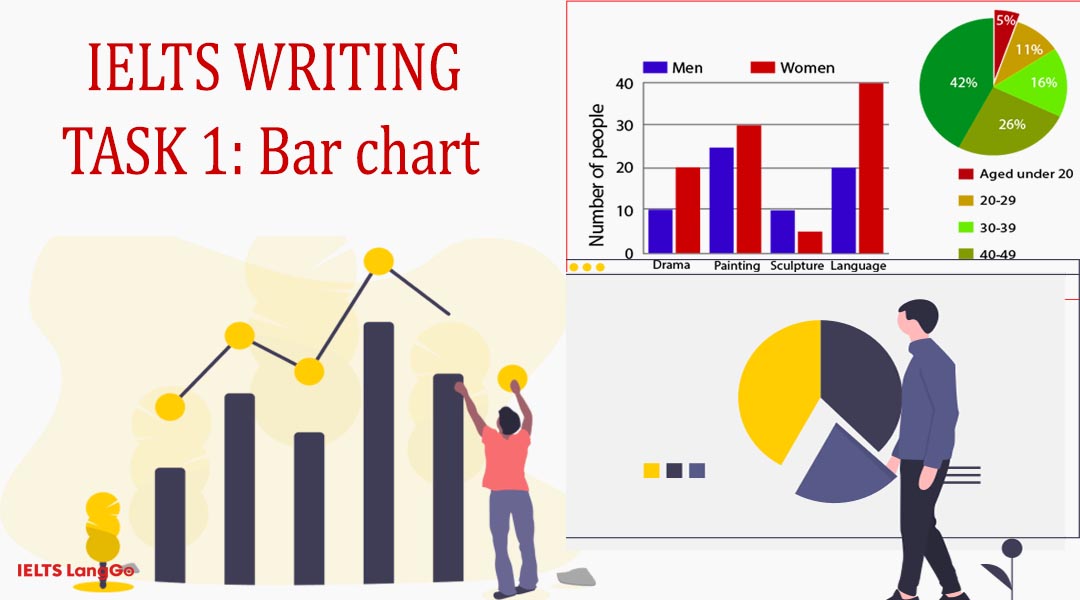
II. Biểu đồ dạng thanh, cột (Bar chart)
1. Biểu đồ dạng thanh, cột (Bar chart) là gì
Biểu đồ dạng thanh, cột (Bar chart) là dạng biểu đồ sử dụng những thanh đứng hoặc nằm ngang để biểu thị số liệu và sự so sánh giữa một số mục. Một trục của biểu đồ Bar chart dùng để biểu thị các hạng mục được so sánh, trục còn lại biểu thị các nấc giá trị (số liệu) riêng biệt.
2. Mẹo làm bài dạng Bar chart
- Các bạn hãy tìm điểm chung và điểm khác biệt chính của các thanh trong biểu đồ.
- Bạn tìm các điểm nổi bật và mô tả chúng: điểm có giá trị cao nhất, thấp nhất trong số các hạng mục.
- Các bạn hãy chú ý đến màu sắc và độ dài hoặc độ rộng của từng thanh, cột; đặc biệt là trong Bar Chart dạng group.
3. Bài mẫu dạng Bar chart
3.1. Bài mẫu số 1: Marriage and divorces
The first bar chart illustrates changes in the number of marriages and divorces in the USA, and the second shows figures for the marital status of American adults in 1970 and 2000.
It is clear that there was a fall in the proportion of marriages in the USA between 1970 and 2000. The majority of adult Americans were married in both years, but the number of single adults was higher in 2000.
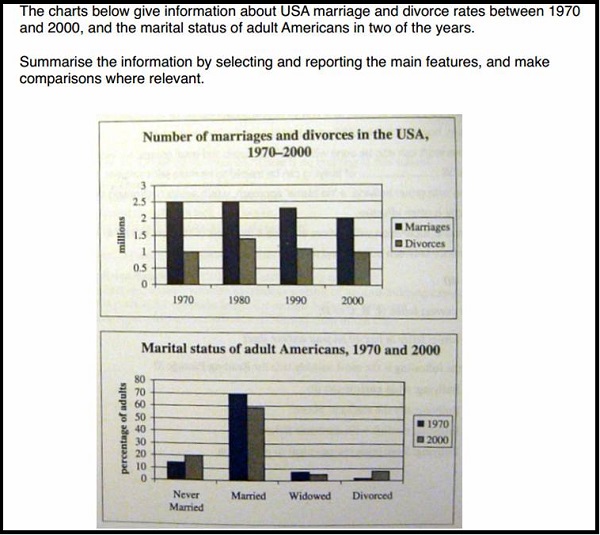
Bài mẫu số 1 dạng Bar chart: Marriage and divorces
There were 2.5 million marriages in the USA and 1 million divorces in 1970. The marriage rate remained steady in 1980, but fell to 2 million by the year 2000. In contrast, the divorce figure peaked in 1980, at nearly 1.5 million divorces, before falling back to 1 million at the end of the period.
In 1970, around 70% of American adults were married, but this rate dropped to just under 60% by 2000. At the same time, the proportion of unmarried people and divorcees increased by about 10% in total. The rate of widowed Americans was slightly lower in 2000.
(173 words)
3.2. Bài mẫu số 2: Level of participation
The charts below illustrate the levels of participation in education and science in developing and industrialised countries in 1980 and 1990.
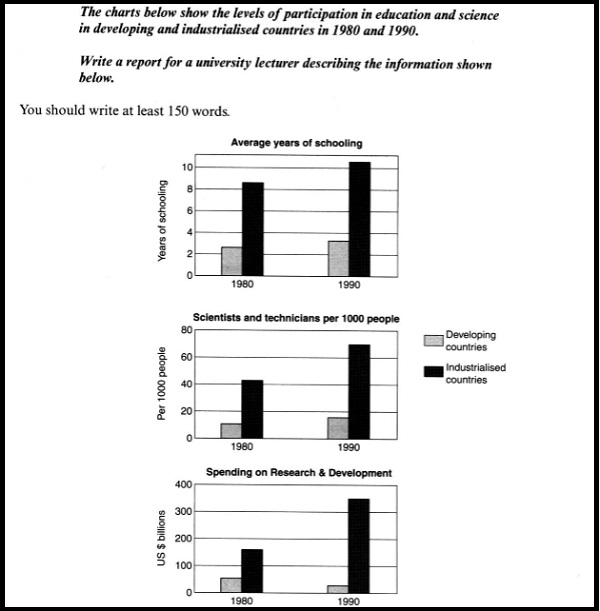
Bài mẫu số 2 dạng Bar chart: Level of participation
The three bar charts show average years of schooling, numbers of scientists and technicians, and research and development spending in developing and developed countries. Numbers are given for 1980 and 1990.
It is clear from the charts that the numbers of developed countries are much higher than those for developing nations. Also, the charts illustrate an overall increase in participation in education and science from 1980 to 1990.
People attended school in developing nations for an average of around 3 years, with only a slight growth in years of schooling from 1980 to 1990. On the other hand, the figure for industrialised countries increase from nearly 9 years of schooling in 1980 to nearly 11 years in 1990.
From 1980 to 1990, the percentage of scientists and technicians in industrialised countries almost doubled to about 70 per 1000 people. Also, Spending on research and development saw rapid growth in these countries, reaching $350 billion in 1990. By contrast, the rate of science workers in developing countries remained below 20 per 1000 people, and research spending reduced from about $50 billion to only $25 billion.
(184 words)
3.3. Bài mẫu số 3: Consumer good
The bar chart shows consumer spending on six different items in Germany, Italy, France and Britain.
It is clear that British people spent remarkably more money than people in the other three countries on all six goods. Consumers spent the most money on photographic film among six items.
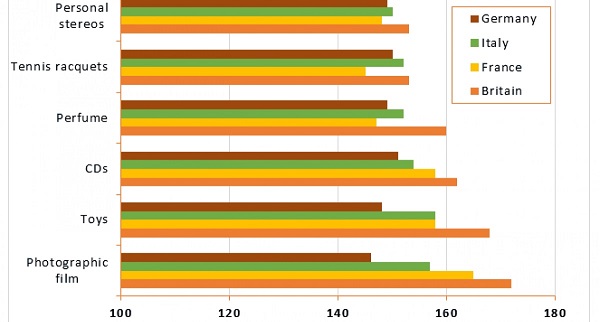
Bài mẫu số 3 dạng Bar chart: Consumer good
People in Britain spent over £170,000 on photographic film, which is the highest number shown on the chart. By contrast, Germans spenders were the lowest, with roughly the same figures (just under £150,000) for each of the six products.
In both France and Italy, the figures for spending on toys were the same at nearly £160,000. However, while French people spent more than Italians on photographic film and CDs, Italians paid out more for personal stereos, tennis racquets and perfumes. The amount spent by French people on tennis racquets, around £145,000, is the lowest figure shown on the chart.
(154 words)
3.4. Bài mẫu số 4: House prices
The bar chart shows the cost of an average house in five major cities over a period of 13 years from 1989.
We can see that house prices decreased overall between 1990 and 1995, but most of the cities saw increasing prices between 1996 and 2002. London experienced by far the greatest changes in house prices over the 13-year period.
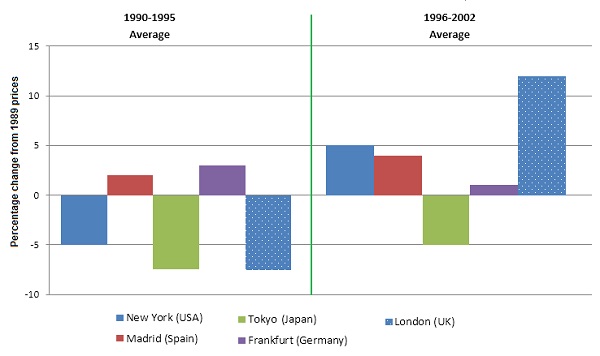
Bài mẫu số 4 dạng Bar chart: House prices
The cost of average homes in Tokyo and London dropped by around 7% over the 5 years after 1989, while New York house prices reduced by 5%. By contrast, prices increased by approximately 2% in both Madrid and Frankfurt.
Between 1996 and 2002, London house prices went up to around 12% above the 1989 average. Homebuyers in New York also had to pay significantly more, with prices increasing to 5% above the 1989 average, but homes in Tokyo remained cheaper than they were in 1989. The cost of an average home in Madrid rose by a further 2%, while prices in Frankfurt remained stable.
(165 words)
Trong phần 2 này, LangGo đã tập trung giúp bạn hiểu rõ về một dạng bài rất hay gặp trong Writing Task 1 là Bar chart (biểu đồ cột). Hy vọng, qua một số mẹo làm bài và các bài Sample mà LangGo tổng hợp trong bài viết, bạn có thể viết dạng bài này tốt hơn và đạt band điểm cao hơn.
Bên cạnh đó, bạn có thể tham khảo thêm các bài viết hữu ích khác về IELTS Writing nhé! Chúc các bạn đạt band điểm Writing thật cao.
Nguồn: Sưu tầm và tổng hợp
HỌC IELTS CAM KẾT 7.0+ - RINH MÁY TÍNH BẢNG

Nhân dịp sinh nhật tuổi thứ 7, IELTS LangGo TẶNG MÁY TÍNH BẢNG cùng nhiều phần quà giá trị cho học viên đăng ký khóa học từ 15/5 – 30/6/2026.
Khóa học IELTS tại LangGo đảm bảo đầu ra lên đến 7.0+:
- CAM KẾT ĐẦU RA theo kết quả thi thật
- Học bổ trợ 1:1 với giảng viên đứng lớp
- 4 buổi bổ trợ Speaking/tháng
- Tăng band chỉ sau 1,5 - 2,5 tháng
- Hỗ trợ đăng ký thi thật tại BC, IDP