Cách làm dạng bài Table (Bảng biểu) trong IELTS Writing Task 1

Table (Bảng biểu) là dạng bài mà nhiều thí sinh cho là khó nhất trong IELTS Writing Task 1. Nhiều bạn sẽ bị mất rất nhiều thời gian cho task này dẫn đến không còn đủ thời gian task 2, vì dạng này thường chứa nhiều số liệu, thông tin làm nhiều người bị rối mắt và cũng rất khó để miêu tả được hết những thông tin này trong bài.
Trong bài viết này, IELTS LangGo sẽ sẽ hướng dẫn chi tiết từng bước cách viết dạng bài Table trong IELTS Writing Task 1, giúp bạn có thể tự tin đối mặt với dạng bài này trong kỳ thi IELTS.
1. Dạng bài Table (Bảng biểu) trong IELTS Writing Task 1 là gì?
Dạng bài Table IELTS Writing Task 1 là dạng bài mà thông tin được trình bày dưới dạng bảng biểu với các hàng và cột chứa dữ liệu, số liệu hoặc thông tin. Nhiệm vụ của thí sinh là mô tả, so sánh và phân tích các thông tin chính trong bảng biểu đó bằng ít nhất 150 từ trong thời gian khoảng 20 phút.
Trong IELTS Writing Task 1, có 2 dạng bài Table thường gặp:
- Bảng biểu không có sự thay đổi theo thời gian
- Bảng biểu có số liệu thay đổi theo thời gian
1.1. Bảng biểu không có sự thay đổi theo thời gian
Ở dạng này, chúng ta không thể chỉ ra xu hướng của các số liệu vì các số liệu này không thay đổi theo thời gian mà hoàn toàn là số liệu tĩnh. Thay vào đó, bạn cần so sánh các số liệu bằng cách lựa chọn những đặc điểm chính của nó và mô tả.
Đặc điểm chính của dạng biểu đồ này thường là điểm cao nhất và thấp nhất của đối tượng so sánh.
Ví dụ
Ví dụ dạng Table Writing Task 1 không có sự thay đổi theo thời gian
Trong bảng này, có 3 tiêu chí được dùng để so sánh giữa 5 nước với nhau và trong cùng 1 thời điểm cụ thể, vậy nên đây là dạng Table không có thời gian.
1.2. Bảng biểu có sự thay đổi theo thời gian
Với dạng có yếu tố thời gian, bản chất của dạng này sẽ giống như biểu đồ line chart, tức là các bạn sẽ sử dụng các từ vựng chỉ sự tăng trưởng như increase, decrease...
Ví dụ:
Ví dụ dạng Table Writing Task 1 thay đổi theo thời gian
2 bảng về 2 đối tượng khác nhau là coffee và bananas. Ở mỗi bảng của 1 đối tượng, số liệu của mỗi nước có sự thay đổi giữa 2 năm 1999 so với 2004.
2. Bố cục dạng bài Table IELTS Writing Task 1
Bài viết dạng Table trong IELTS Writing Task 1 cần tuân theo một cấu trúc rõ ràng gồm 4 phần chính:
Phần 1. Introduction (Mở bài)
- Giới thiệu về bảng biểu, nêu rõ đối tượng và nội dung chính được thể hiện trong bảng
- Paraphrase (diễn giải lại) đề bài, không copy y nguyên câu từ đề bài
Phần 2. Overview (Tổng quan)
- Trình bày 2-3 điểm nổi bật, xu hướng chung nhất từ bảng biểu
- Không đi vào chi tiết các con số cụ thể
- Đây là phần quan trọng ảnh hưởng đến band điểm Task Achievement
Phần 3. Body Paragraph 1 (Thân bài 1)
- Mô tả chi tiết hơn về một hoặc một số nhóm thông tin trong bảng
- Sử dụng các con số cụ thể để minh họa
- Liên kết các thông tin với nhau một cách hợp lý
Phần 4. Body Paragraph 2 (Thân bài 2)
- Mô tả chi tiết các nhóm thông tin còn lại trong bảng.
- Sử dụng các con số cụ thể để minh họa
- Liên kết các thông tin với nhau một cách hợp lý
3. Cách viết dạng Table trong IELTS Writing Task 1
Để viết bài Writing Task 1 dạng bảng biểu một cách hiệu quả, đáp ứng các tiêu chí của bài viết, các bạn nên thực hiện theo 5 bước sau:
Bước 1: Phân tích đề
- Đối tượng chính của biểu đồ
- Đơn vị
- Mốc hay khoảng thời gian
- Thì của động từ
Ví dụ:
.png)
Nhìn vào bảng ta có thể thấy :
- Thì động từ là quá khứ đơn - Mốc thời gian 2002
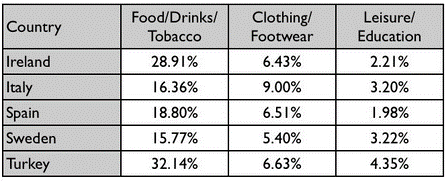
- Đơn vị %
- Đối tượng chính là phần trăm chi tiêu của người tiêu dùng cho 3 nhóm tiêu dùng khác nhau.
Bước 2: Chọn lọc những thông tin nổi bật nhất
Chúng ta sẽ đọc những số liệu được thể hiện trong bảng số liệu, những số liệu này sẽ được viết theo hàng hoặc theo cột
- Dữ liệu có giá trị cao nhất, cao nhì.
- Dữ liệu có giá trị thấp nhất, thấp nhì.
- Nhóm dự liệu trong hàng hay cột có sự tương đồng, giống nhau.
- Nhóm dự liệu trong hàng hay cột có sự tương phản, khác nhau.
Ví dụ:
Nhìn vào bảng này ta có thể thấy
- % của tất cả các nước về Food/Drinks/Tobacco đều hơn 2 tiêu chí còn lại và tiêu chí có % thấp nhất là Leisure/Education.
- Ở tiêu chí so sánh đầu tiên, Turkey có % cao nhất 32.14% và thấp nhất là Sweden 15.77%
- Ở tiêu chí so sánh thứ hai, Italy cao nhất 9.00%, trong tiêu chí này thì tất cả các nước còn lại có số liệu gần như nhau ~6%
- Ở tiêu chí cuối, Spain thấp nhất với 1.98%, các nước còn lại thì số liệu như nhau, 2-3%
- Nhìn chung ở tất cả 3 tiêu chí thì Turkey có số % cao nhất.
Bước 3: Paraphrase lại đề bài để viết Introduction
Viết lại bằng ngôn ngữ, cấu trúc của mình, khác với những từ ngữ đã được đề sử dụng. Chỉ viết trong 1-2 câu.
Ví dụ:
The table displays percentages of consumer outlay for three categories of products and services in five countries in 2002
Chúng ta paraphase những từ xuất hiện trong đề bằng những từ khác:
- Gives information = display
- Expenditure = outlay
- Items = categories
Bước 4: Xác định ý viết Overview
Ví dụ:
It is obvious that the percentage of food, drinks, and tobacco has the highest number of consumer spending in each country. Besides that the leisure and education categories has the lowest proportion in the table.
Bước 5: Nhóm thông tin để viết vào 2 đoạn body
Cần tìm ra những đặc điểm chính trong bảng, tập hợp thành 2 nhóm dành để viết 2 đoạn body, có 1 lưu ý là không nhất thiết phải viết toàn bộ số liệu được nêu ra trong bảng. Mỗi đoạn viết khoảng 3 - 4 câu.
Ví dụ:
Among the five countries, consumer spending on food, drinks and tobacco was significantly higher in Turkey, at 32.14% and Ireland, at nearly 29%. Entertainment and education rates are also at the highest position, 4.35% at Turkey, while clothing and footwear spending in Italy is noticeably higher, at 9%, than any of the remaining countries.
It can be seen that Sweden had the lowest national consumer spending rate for food / drinks/ tobacco as well as for clothing / footwear, at nearly 16% and just over 5%. Spain has a slightly higher figure for these categories, but the lowest figure for entertainment / education, only at 1.98%.
4. Ví dụ cách viết 2 dạng Table trong IELTS Writing Task 1
4.1. Ví dụ về dạng bài có thay đổi theo thời gian
Bước 1: Phân tích đề
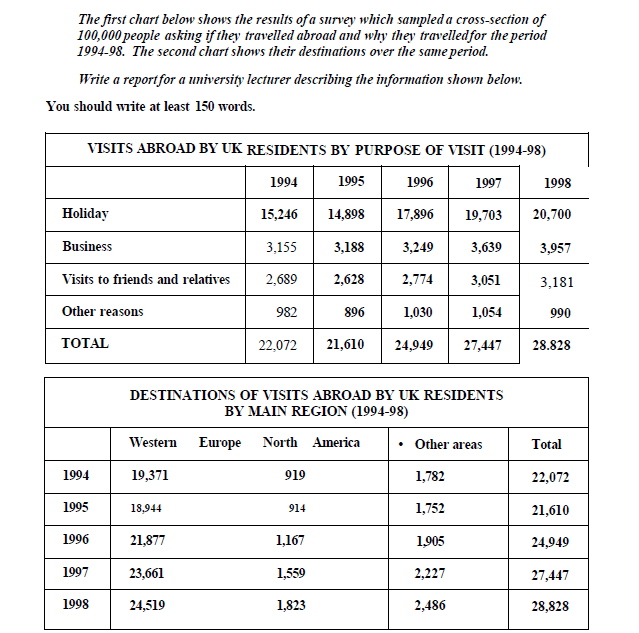
- Đối tượng của biểu đồ: người Anh đi du lịch nước ngoài (đơn vị người)
- Khoảng thời gian: 1994 - 1998 => phân tích phải viết bằng thì quá khứ đơn
Bước 2: Paraphase đề bài:
The given table illustrates the purposes of British inhabitant goes oversea between 1994 to 1998 and their destination.
Bước 3: Viết Overview
- Table 1 - biểu thị số lượng: số lượng người dân Anh đi nước ngoài vì nghỉ dưỡng là lớn nhất.
- Table 2 - biểu thị xu hướng chính: số lượng người Anh đến châu Âu là nhiều nhất và tăng dần qua các năm
As is revealed from the first table, overall, it is obvious that the main purpose of travelling abroad among UK residents was for relaxation, meanwhile the number of British people going overseas for unspecific reasons was the lowest. It is also clear from the second table that Western Europe was the most favourable destination among the three surveyed areas.
Bước 4: Lựa chọn thông tin để viết body
- Table 1: miêu tả số lượng:
+ Năm 1994: số người đi nghỉ dưỡng chiếm phần lớn, gấp 5 lần so với những người đi công tác (business reason)
+1994-1998: số lượng người đi nghỉ dưỡng giảm nhẹ vào năm thứ 2 và tăng mạnh ở những năm tiếp theo
+ Miêu tả yếu tố có cùng xu hướng với "Số người đi nghỉ dưỡng" : những người đi thăm người thân và bạn bè.
+Miêu tả yếu tố còn lại: số người đi công tác tăng dần, số người đi với lí do khác hầu như không thay đổi.
To be more specific, in 1994, there were more than fifty thousand English traveling abroad for holiday, approximately five-fold higher than the number of people going for business in the same year. This figure decreased slightly by 1 000 people after one year before experiencing a gradual increase to over 20 000 during the next three years. Similarly, one in ten of surveyed people responded that visiting friends and relatives was the main purpose of their overseas travelling in the first year. This number inconsiderably decreased by 60 people in 1995 and then witnessed a growth to more than 3 000 people in the last year. Besides, residents travelling to a foreign country for work in UK rose steadily/ moderately by nearly 1 000 people while the figure for those going for unspecific reasons almost remained unchanged/ stable throughout the time frame, at around 1 000 travellers.
- Table 2:
+ Số người Anh đi đến Western Europe ở năm 1994 là hơn 19,000; giảm nhẹ ở năm thứ 2 và tăng liên tục vào những năm tiếp theo
+ Tương tự với số người Anh đến những địa điểm khác cũng có xu hướng tương tự.
Turning to the second table, standing at 19 000 people in 1994, the number of visitors to Western Europe showed a significant decline to 18 944 people one year later before increasing again to nearly 25 000 people till the last year. Following the same trend, the number of British travellers to other areas dropped from
1 782 in 1994 to 1 752 in 1995, and finally experiencing a growth of 700 people.
Bài viết hoàn chỉnh
The given table illustrates the purposes of Bristish inhabitant goes oversea between 1994 to 1998 and their destination.
As is revealed from the first table, overall, it is obvious that the main purpose of travelling abroad among UK residents was for relaxation, meanwhile the number of British people going overseas for unspecific reasons was the lowest. It is also clear from the second table that Western Europe was the most favourable destination among the three surveyed areas.
To be more specific, in 1994, there were more than fifty thousand English traveling abroad for holiday, approximately five-fold higher than the number of people going for business in the same year. This figure decreased slightly by 1 000 people after one year before experiencing a gradual increase to over 20 000 during the next three years. Similarly, one in ten of surveyed people responded that visiting friends and relatives was the main purpose of their overseas travelling in the first year. This number inconsiderably decreased by 60 people in 1995 and then witnessed a growth to more than 3 000 people in the last year. Besides, residents travelling to a foreign country for work in UK rose steadily/ moderately by nearly 1 000 people while the figure for those going for unspecific reasons almost remained unchanged/ stable throughout the time frame, at around 1 000 travellers.
Turning to the second table, standing at 19 000 people in 1994, the number of visitors to Western Europe showed a significant decline to 18 944 people one year later before increasing again to nearly 25 000 people till the last year. Following the same trend, the number of British travellers to other areas dropped from 1 782 in 1994 to 1 752 in 1995, and finally experiencing a growth of 700 people.
4.2 Ví dụ về dạng bài không có thay đổi theo thời gian
Bước 1: Phân tích
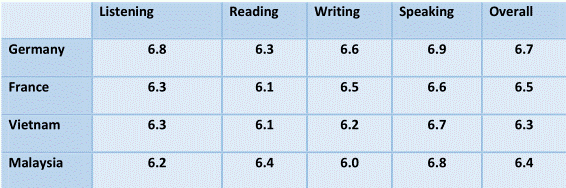
- Đối tượng của biểu đồ: điểm thi IELTS của học sinh tại 4 nước trong năm 2009
- Khoảng thời gian 2009: thì quá khứ đơn
Bước 2: Paraphase đề bài
The given table show the results of candidates, who attended Ielts examination in the various countries in 2009.
Bước 3: Viết Overview
- Đặc điểm chung:
+ Học sinh ở đức có tổng điểm thi Ielts cao nhất, trong đó các kĩ năng Listening, Writing và Speaking là cao nhất so với các nước còn lại.
+ Việt Nam là nước có band điểm IELTS overall thấp nhất
+ Mặt khác, học sinh ở Malaysia lại có kĩ năng Reading tốt nhất.
+ Ở cả 4 nước, kĩ năng nói của học sinh là tốt nhất.
As is obviously revealed from the given table, while German students show the
highest achievement in Ielts results in the year, including Listening, Writing and Speaking skill. However, the best performance in Reading skill belongs to Malaysia candidates. It's also clear that, Speaking was the best IELTS skills for all attendants in the same year.
Bước 4: Lựa chọn ý để viết body
- Body 1: so sánh 2 nước có điểm IELTS cao nhất là Germany và France
+ Học sinh Đức đạt điểm overall cao nhất là 6.7; Học sinh Pháp xếp thứ nhì ở mức điểm là 6.5
+ Cả 2 nước đều dẫn đầu với số điểm Writing là 6.6 (Đức) và 6.5 (Pháp).
As can be seen from the table, the highest average overall band score of 6.7 belonged to German students while the second one was gained by France students. In addition, German and France candidates performed
a greatest achievement in writing skills with the average band score of 6.9 and
6.7 respectively.
- Body 2: so sánh 2 nước có điểm IELTS overal thất nhất là Vietnam và Malaysia
+ Điểm overall của học sinh Việt Nam thấp nhất trong cả bốn nước, học sinh Malaysia cao hơn một chút (6.4 > 6.3)
+ Kỹ năng Listenning và Writing của thí sinh Việt Nam tốt hơn so với Malaysia, ngược lại điểm thi kĩ năng Reading và Speaking của Malaysia lại cao hơn Việt Nam.
+ Điểm số Reading của Malaysia là cao nhất trong tất cả các nước.
Vietnamese student showed a lowest score in overall at 6.3, while Malaysia ones were slightly higher than at 6.4. However, Ielts attendants in VietNam achieved higher results in Listening skill and Writing skill than Malaysia student. In contrast, Malaysia students spoke and read better than Vietnamese ones in the English exam. Also, reading is the strong point of Malaysian candidates with the highest record of 6.4 in Ielts examination.
Bài viết hoàn chỉnh:
The given table show the results of candidates, who attended IELTS examination in the various countries in 2009.
As is obviously revealed from the given table, while German students show the
highest achievement in Ielts results in the year, including Listening, Writing and Speaking skill. However, the best performance in Reading skill belongs to Malaysia candidates. It's also clear that, Speaking was the best IELTS skills for all attendants in the same year.
As can be seen from the table, the highest average overall band score of 6.7 belonged to German students while the second one was gained by France students. In addition, German and France candidates performed a greatest achievement in writing skills with the average band score of 6.9 and 6.7 respectively.
Vietnamese student showed a lowest score in overall at 6.3, while Malaysia ones were slightly higher than at 6.4. However, Ielts attendants in VietNam achieved higher results in Listening skill and Writing skill than Malaysia student. In contrast, Malaysia students spoke and read better than Vietnamese ones in the English exam. Also, reading is the strong point of Malaysia candidates with the highest record of 6.4 in Ielts examination.
5. Gợi ý 2 cách triển khai thông tin chi tiết ở phần Body
Cách 1: Nhóm các hàng hoặc cột có sự tương đồng với nhau
Cách này chúng ta có thể chia nhỏ ra làm 2 cách, 1 là viết theo hàng, 2 là viết theo cột.
Ví dụ:
The table below gives information on consumer spending on different items in five different countries in 2002.
Summarise the information by selecting and reporting the main features, and make comparisons where relevant.
Write at least 150 words.
Với ví dụ này chúng ta sẽ viết theo cột, thì sẽ viết 3 đoạn, mỗi đoạn về 1 cột
- Đoạn 1: viết về tiêu chí Food/Drinks/Tobacoo, Turkey cao nhất với 32.14% và thấp nhất là Sweden với 15.77%.
- Đoạn 2: Viết tiêu chí Clothing/Footwear, sẽ nói tới Italy và Sweden lần lượt là nước có % cao nhất và thấp nhất
- Đoạn 3: Viết về tiêu chí Leisure/Education, sẽ viết về 1.98% và 4.35% là 2 giá trị % cao nhất và thấp nhất.
Bài viết hoàn chỉnh:
The table displays percentages of consumer outlay for three categories of products and services in five countries in 2002
Overall, all countries spent most on food, drinks and tobacco, which was almost three times that of the other items. The lowest spending was on leisure and education in the five countries. The spending of Turkey overall was higher than the other countries.
In food, drinks and tobacco criterion, The spending of Turkey is the most at 32.14%. Ireland also spent highly (28.91%) compared to Sweden which spent the least (15.77%). Spain and Italy spent 18.80% and 16.36% respectively.
Sweden spent less than the other countries on clothing and footwear (5.40%) as opposed to the highest spending in Sweden at 9.00%. The other three countries spent on average around 6.5%.
The lowest spending was on leisure and education which accounted for under 5% in all countries. Turkey spent most on these items at just 4.35% of their national spending which is around double that of Spain which spent the least at just 1.98%.
Cách 2: Viết theo số liệu tương đồng nhau
Chúng ta sẽ tạo nhóm những số liệu có mối liên hệ với nhau, rồi tiến hành phân tích nhóm số liệu đó.
Đối với ví dụ ở trên, chúng ta sẽ viết bằng cách chia ra làm 2 nhóm số liệu để viết 2 đoạn
- Đoạn 1: viết về những nước có % lớn nhất ở các tiêu chí là Turkey (32.14% và 4.35%) và Italy (9.00%)
- Đoạn 2: viết những nước còn lại với những số liệu đặc trưng như Ireland (28.91%), Spain (1.98%), Sweden (15.77% và 5.40%)
Bài viết hoàn chỉnh:
The table displays percentages of consumer outlay for three categories of products and services in five countries in 2002
It is obvious that the percentage of food, drinks and tobacco has the highest number of consumer spending in each country. Besides that the leisure and education categories has the lowest proportion in the table.
Among the five countries, consumer spending on food, drinks and tobacco was significantly higher in Turkey, at 32.14% and Ireland, at nearly 29%. Entertainment and education rates are also at the highest position, 4.35% at Turkey, while clothing and footwear spending in Italy is noticeably higher, at 9%, than any of the remaining countries.
It can be seen that Sweden had the lowest national consumer spending rate for food / drinks/ tobacco as well as for clothing / footwear, at nearly 16% and just over 5%. Spain has a slightly higher figure for these categories, but the lowest figure for entertainment / education, only at 1.98%
6. Từ vựng hữu ích cho dạng bài Table IELTS Writing Task 1
Sử dụng từ vựng đa dạng và chính xác là một trong những yếu tố quan trọng để đạt điểm cao trong IELTS Writing Task 1. Dưới đây là một số từ vựng hữu ích mà bạn có thể vận dụng khi viết dạng bảng biểu trong Task 1
Từ vựng mô tả bảng biểu
- illustrate (v): minh họa
Ví dụ: The table illustrates the changing patterns of internet usage.
- depict (v): mô tả
Ví dụ: The data depicted in the table shows significant variations.
- present (v): trình bày
Ví dụ: The information is presented in a comparative format.
- demonstrate (v): chứng minh
Ví dụ: The figures demonstrate a clear correlation between age and internet usage.
- provide information about (v): cung cấp thông tin về
Ví dụ: The table provides information about consumer preferences.
Từ vựng mô tả sự tăng lên
- increase (v/n): tăng
Ví dụ: There was an increase of 10% in the population.
- rise (v/n): tăng lên
Ví dụ: The figures rose sharply between 2010 and 2015.
- grow (v): phát triển
Ví dụ: The number of users grew steadily over the period.
- surge (v/n): tăng đột biến
Ví dụ: A sudden surge in demand was recorded in December.
- soar (v): tăng vọt
Ví dụ: Prices soared to unprecedented levels.
- escalate (v): leo thang
Ví dụ: Costs escalated dramatically in the final quarter.
- climb (v): leo lên
Ví dụ: The percentage climbed from 45% to 78%.
Từ vựng mô tả sự giảm xuống
- decrease (v/n): giảm
Ví dụ: A decrease in participation was observed.
- decline (v/n): suy giảm
Ví dụ: The market share showed a gradual decline.
- fall (v/n): rơi, giảm
Ví dụ: The numbers fell significantly after 2018.
- drop (v/n): giảm xuống
Ví dụ: There was a sharp drop in attendance.
- plummet (v): lao dốc
Ví dụ: Sales plummeted by 35% during the recession.
- diminish (v): giảm bớt
Ví dụ: The impact of the program diminished over time.
- reduce (v): giảm
Ví dụ: The percentage was reduced from 67% to 42%.
Từ vựng mô tả sự ổn định
- remain stable (v): giữ ổn định
Ví dụ: The figures remained stable throughout the period.
- maintain a level (v): duy trì mức độ
Ví dụ: The company maintained a level of production.
- stay constant (v): giữ nguyên
Ví dụ: The rate stayed constant at around 15%.
- plateau (v/n): đạt mức ổn định
Ví dụ: After rapid growth, the numbers reached a plateau.
- show little change (v): thể hiện ít thay đổi
Ví dụ: The middle group showed little change over the years.
Từ vựng mô tả mức độ
- significant (adj): đáng kể
Ví dụ: There was a significant difference between the groups.
- substantial (adj): đáng kể
Ví dụ: A substantial majority preferred the first option.
- considerable (adj): đáng kể
Ví dụ: The data showed considerable variation.
- marginal (adj): nhỏ, không đáng kể
Ví dụ: Only a marginal improvement was noted.
- dramatic (adj): ấn tượng
Ví dụ: The results revealed a dramatic contrast.
- negligible (adj): không đáng kể
Ví dụ: The difference was negligible at less than 1%.
Từ vựng liên kết ý
- however: tuy nhiên
Ví dụ: The first group showed high participation; however, the second group did not.
- in contrast: ngược lại
Ví dụ: In contrast, the older demographic showed much lower figures.
- similarly: tương tự
Ví dụ: Similarly, the neighboring countries exhibited comparable trends.
- moreover: hơn nữa
Ví dụ: Moreover, the data indicated a strong correlation between the variables.
- while: trong khi
Ví dụ: While group A showed improvement, group B declined steadily.
- whereas: trong khi đó
Ví dụ: The urban population increased rapidly, whereas the rural population decreased.
7. Lưu ý khi viết dạng Table trong IELTS Writing Task 1
Dưới đây là một số lưu ý khi viết dạng bài bảng biểu trong Writing Task 1:
- Không được nêu quan điểm của bản thân hay những thông tin không có, không liên quan tới đề bài cho
- Không nên nêu hết tất cả số liệu mà đề bài cho vô bài viết => phải biết chọn lọc thông tin
- Đã viết phần Tổng quát (Overview) thì không cần viết kết luận nữa.
- Trong phần Tổng quát không đưa số liệu vào, chỉ đề cập tới các ý chính thôi.
Lời khuyên cho Overview Paragraph
Ở phần này, cố gắng để so sánh tất cả các đối tượng trong biểu đồ (cả hàng dọc lẫn hàng ngang) bằng cách như sau:
- So sánh các đối tượng ở hàng dọc → Nhắc đến số liệu cao nhất
- So sánh các đối tượng ở hàng ngang → Nhắc đến số liệu cao nhất
- Chỉ cần duy nhất 2 câu cho phần này
Lời khuyên cho Body Paragraphs
Không bao giờ được miêu tả từng đối tượng (hàng dọc, hàng ngang) một cách riêng lẻ, giám khảo luôn muốn thấy sự so sánh trong bài viết của bạn.
Mỗi đoạn hãy chia thành nhóm:
- Nhóm 1: So sánh số liệu cao nhất của tất cả các đối tượng với nhau
- Nhóm 2: So sánh số liệu thấp nhất của tất cả đổi tượng với nhau.
Lời khuyên cho Chọn số liệu để phân tích
- Dữ liệu có giá trị cao nhất
- Dữ liệu có giá trị thấp nhất
- Dữ liệu cao hay thấp thứ 2 (nhưng phải gần với 2 con số ở trên)
- Có sự tương đồng, giống nhau nào giữa các số liệu ở cùng hàng hay cùng cột không.
- Có sự khác biệt, tương phản nào giữa các số liệu ở cùng hàng hay cùng cột không.
8. Bài mẫu tham khảo dạng Table trong IELTS Writing task 1
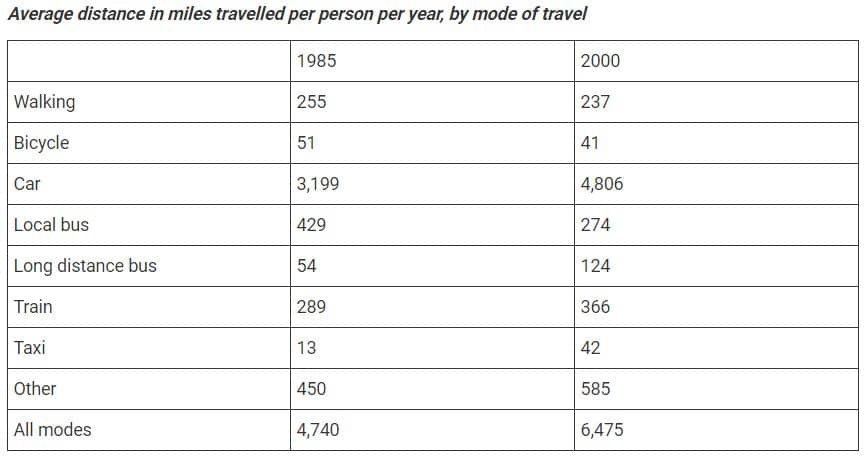
The table below gives information about changes in modes of travel in England between 1985 and 2000.
Summarise the information by selecting and reporting the main features and make comparison where relevant.
Bài mẫu tham khảo
The table compares the use of different means of transport according to the average distance in two years, 1985 and 2000.
It is clear that car was the most popular mode of transport among the list given. The distance travelled by each person using almost all these forms increased, except for walking, bicycle and local bus whose figures declined.
In 1985, the average distance by all means of transport was 4,740 miles, in which car was used to move on 3,199 miles. Local bus recorded 429 miles, which nearly doubled the figures for walking and train. However, the distances that people cycled or moved by long distance bus and taxi were minimal, at around 50 miles or even shorter.
After 15 years, the average distance that each person traveled increased to 6,475 miles, and most of this distance was by car, which rose to 4,806 miles. The other forms of transport, including long distance bus, train, taxi and others all recorded a rise of up to 135 miles. In contrast, local bus, bicycle and walking were not used as commonly as in 1985, with its figures declining by up to 155 miles.(192 words)
Trên đây là hướng dẫn chi tiết cách viết dạng bài Table trong IELTS Writing Task 1.
Các bạn hãy áp dụng các bước viết bài được trình bày trong bài viết này và luyện tập thường xuyên để tự tin hơn khi đối mặt với dạng bài Table trong IELTS Writing Task 1 nhé. Chúc các bạn thành công!
HỌC IELTS CAM KẾT 7.0+ - GIẢM TỐI ĐA 12 TRIỆU

Bạn là học sinh, sinh viên muốn bứt phá band điểm IELTS? LangGo tặng bạn ưu đãi CỰC LỚN lên tới 12.000.000 VNĐ khi đăng ký lộ trình tăng từ 2 band!
Khóa học IELTS tại LangGo đảm bảo đầu ra lên đến 7.0+:
- CAM KẾT ĐẦU RA theo kết quả thi thật
- Học bổ trợ 1:1 với giảng viên đứng lớp
- 4 buổi bổ trợ Speaking/tháng
- Tăng band chỉ sau 1,5 - 2,5 tháng
- Hỗ trợ đăng ký thi thật tại BC, IDP